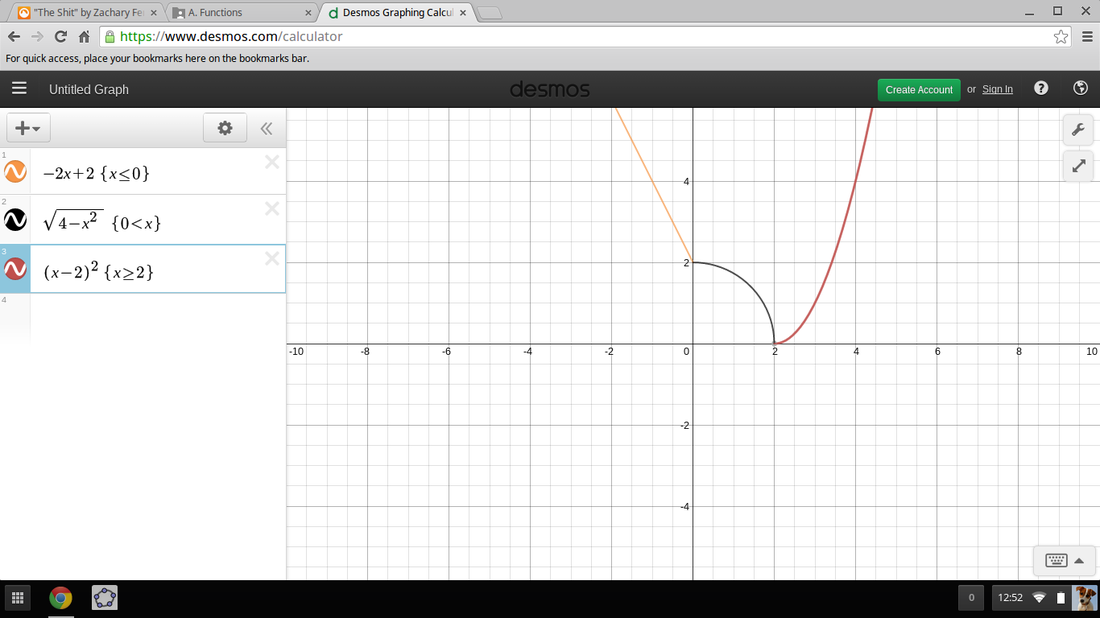
 | 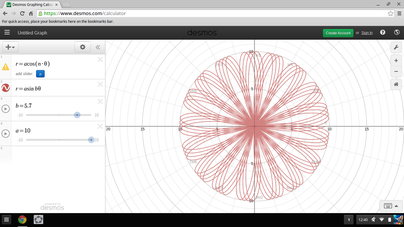 |
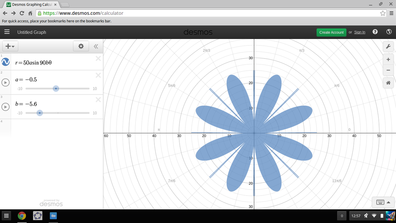
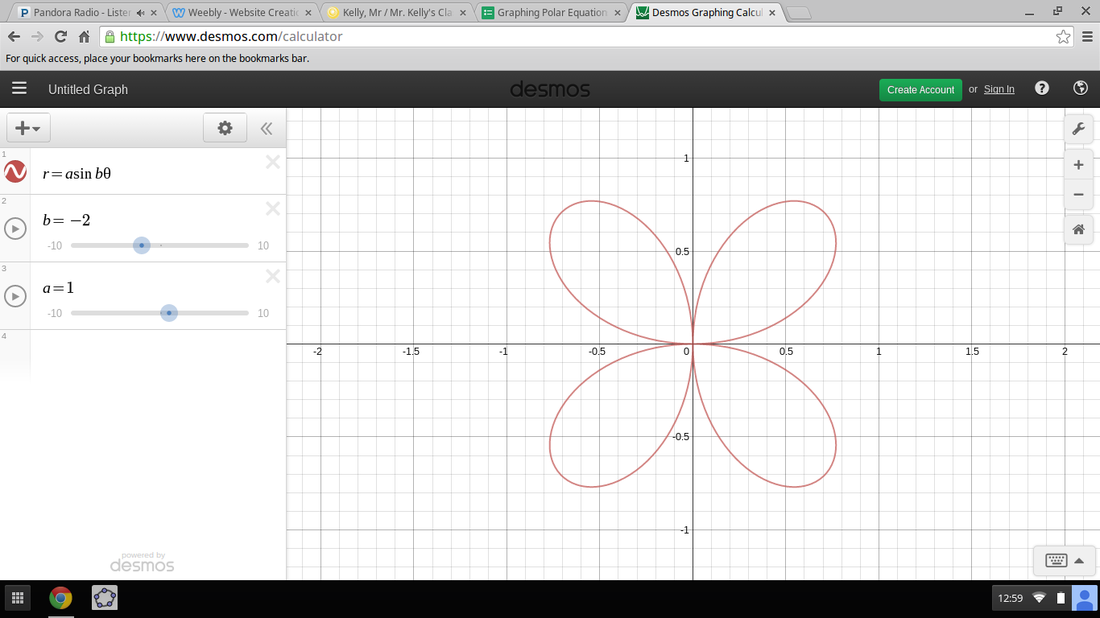
In this project we were told to use r=asinbtheta as an equation. When typing that into demos you get a art work thats a rose. When playing with slider a, the bigger the number was the bigger the graph would be. If you were to set it at 0 then the graph would disappear. When playing with slider b, every prime number would make it bigger, but every decimal number would add more lines into the rose. These two pictures shown above shows you the creations made by playing with the sliders. In the first picture of my creation i made slider a an high number and slider b a decimal to increase the lines. In the second creation i went low number for slider a, and an negative number for slider b. This is what happens when you play with slider a and b using the equation r=asinbtheta.
0 Comments
In this project we had to make an ambulance sound. To change the tone we had to change the amplitude, but to also make the longer sound we had to maintain the period, or delay. When we changed the delay it stressed the sound to make a longer sound. I found this activity fun, and learned a little bit more about Arduino.
In this activity i learned a little bit about subsidized loans. There is an equation used to help solve problems about loans and it is A=P(1+r)^n. Now every letter has its own meeting like P is for principal. A is for the amount you owe on the loan total, R stands for fixed annual interest in decimal. Lastly N stands for the number of years. So after learning all of that, There is also another formula that can also be used like A=P(1+r/k)^kt. Now K stands for number of time interest is compounded per year and T stands for amount of years. For an example if i invest 500$ at a compound annually, than how much would i invested after 10 years? The answer is 983.57 :)
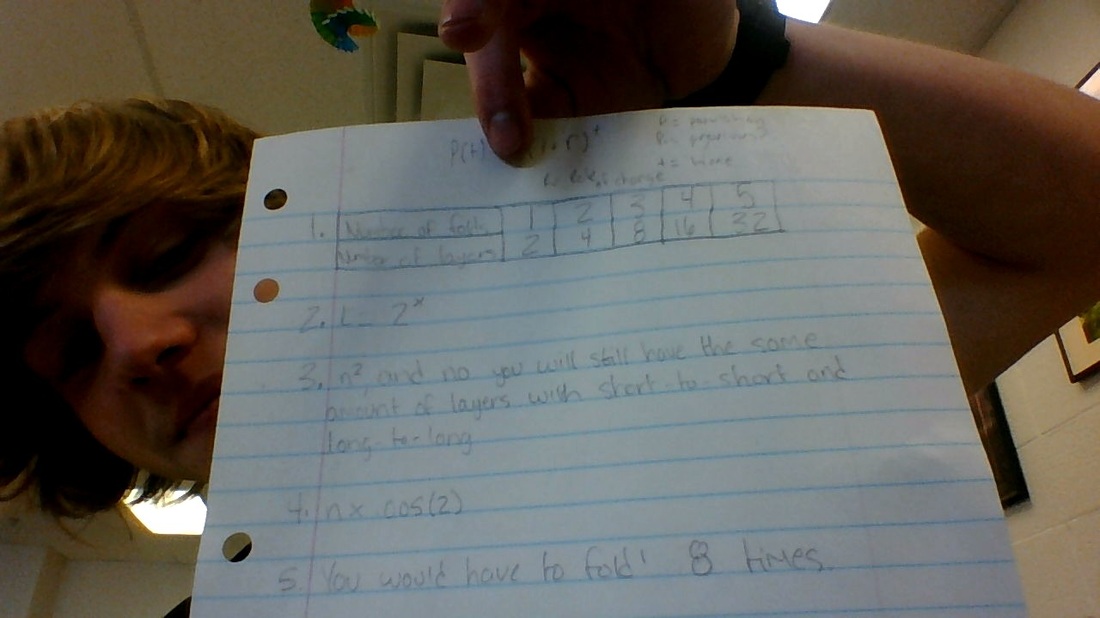
How many folds does it take to get to the moon? My answer is 42, and its super unrealistic because folding that object that many times. There is no way that it would reach the moon in 42 folds. Im guessing that it would be wide, but i do not think that really matters. After doing this assignment i figured that with every fold the layers increase by two. Also there will eventually be a time where you can not fold anymore, because of a bog in the paper! You must take each fold and add the layers together. After it is all done it would take 42 folds to get to the moon!
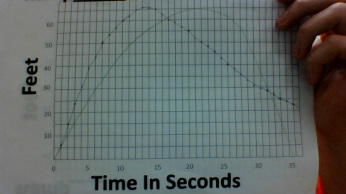
The graph shown above is a skateboard being pushed down a 21 inch ramp, then being recorded in feet how far it went. The green line is our prediction, and the dotted line is the actual distance. We had recorded it for a period of 35 seconds. 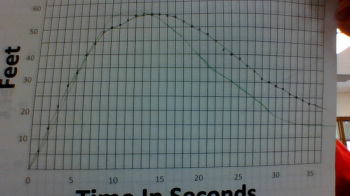
The graph shown above is a skateboard being pushed down a ramp of 14 inches, rolling for approximately 35 seconds. Green line is the prediction of the time and distance at that time. The dotted line is the actual time and distance. 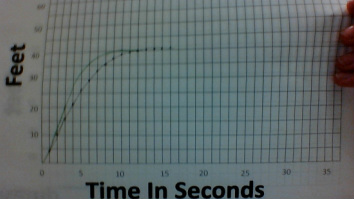
This final graph shown above the skateboard is being pushed down a 7 inch ramp to let it roll for 35 seconds or more. The green line is the prediction and the dotted is the actual. The skateboard had stopped at 40 feet and did not go backwards.
| AuthorWrite something about yourself. No need to be fancy, just an overview. ArchivesJanuary 2015 Categories |
 RSS Feed