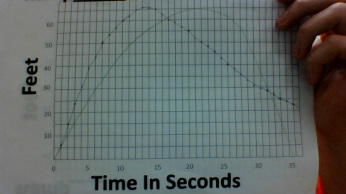
The graph shown above is a skateboard being pushed down a 21 inch ramp, then being recorded in feet how far it went. The green line is our prediction, and the dotted line is the actual distance. We had recorded it for a period of 35 seconds.
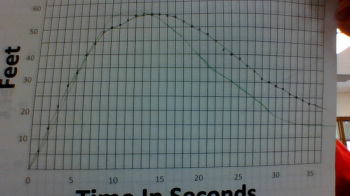
The graph shown above is a skateboard being pushed down a ramp of 14 inches, rolling for approximately 35 seconds. Green line is the prediction of the time and distance at that time. The dotted line is the actual time and distance.
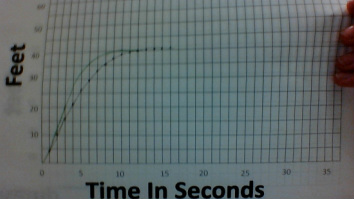
This final graph shown above the skateboard is being pushed down a 7 inch ramp to let it roll for 35 seconds or more. The green line is the prediction and the dotted is the actual. The skateboard had stopped at 40 feet and did not go backwards.
 RSS Feed